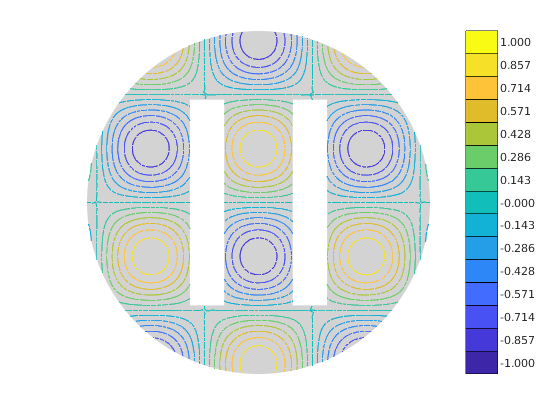
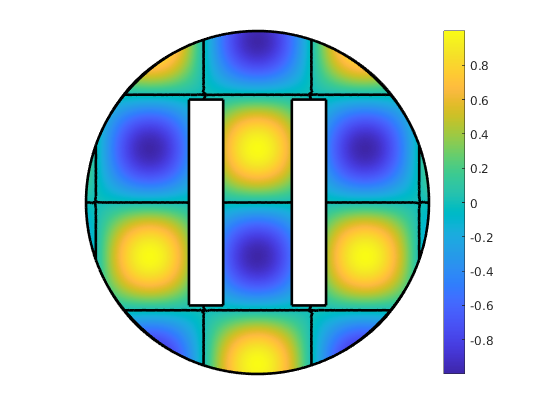
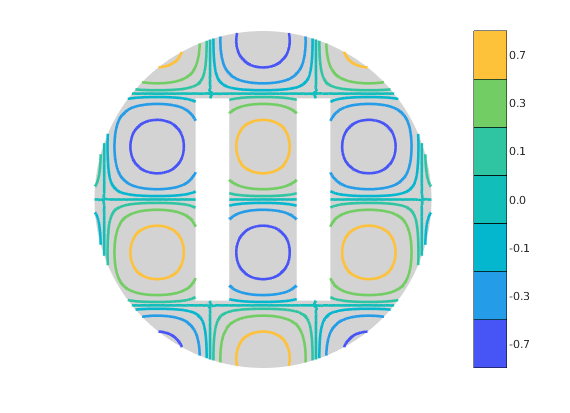
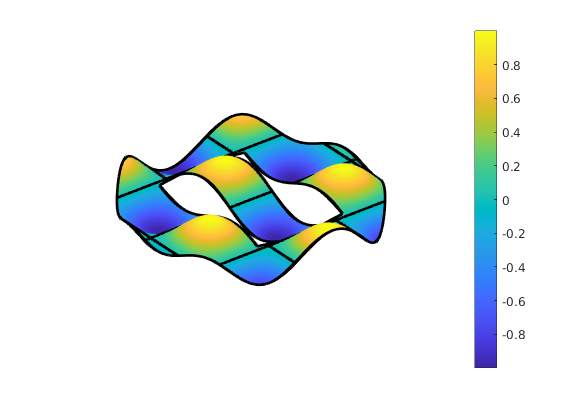
  u=@(x,y) cos(x).*sin(y);
  [q2,me2,toGlobal2]=fc_meshtools.simplicial.getMesh2D(2);
  [q1,me1,toGlobal1]=fc_meshtools.simplicial.getMesh2D(1);
  U2=fc_meshtools.eval(u,q2);
  U1=fc_meshtools.eval(u,q1);

  figure(1)
  fc_graphics4mesh.plotmesh(q2,me2,'color','LightGray','fill',true, 'EdgeColor','None','FaceColor','LightGray')
  hold on
  fc_graphics4mesh.plotiso(q2,me2,U2,'plane',true, 'niso',15,'isocolorbar',true,'format','%.3f','LineWidth',1)
  axis image;axis off

  figure(2)
  fc_graphics4mesh.plot(q2,me2,U2,'plane',true)
  hold on
  fc_graphics4mesh.plotiso(q2,me2,U2,'plane',true, 'Color','w','isorange',0,'LineWidth',2)
  fc_graphics4mesh.plotmesh(q1,me1, 'LineWidth',2, 'Color','k')
  colorbar
  shading interp
  axis image;axis off

  figure(3)
  fc_graphics4mesh.plotmesh(q2,me2,'z',U2,'fill',true,'Color','LightGray')
  hold on
  isorange=[-0.7,-0.3,-0.1,0,0.1,0.3,0.7];
  fc_graphics4mesh.plotiso(q2,me2,U2,'LineWidth',2, 'isorange',isorange,'isocolorbar',true,'format','%.1f')
  axis image;axis off
  figure(4)
  fc_graphics4mesh.plot(q2,me2,U2)
  hold on
  fc_graphics4mesh.plotiso(q2,me2,U2,'LineWidth',2, 'Color','w','isorange',0,'LineWidth',2)
  fc_graphics4mesh.plotmesh(q1,me1,'z',U1,'LineWidth',2, 'Color','k')
  axis image;axis off
  shading interp
  colorbar