plot2D
geofile=fc_simesh.get_geo(2,2,'condenser11');
meshfile=fc_oogmsh.gmsh.buildmesh2d(geofile,25,'verbose',0);
Th=fc_simesh.siMesh(meshfile);
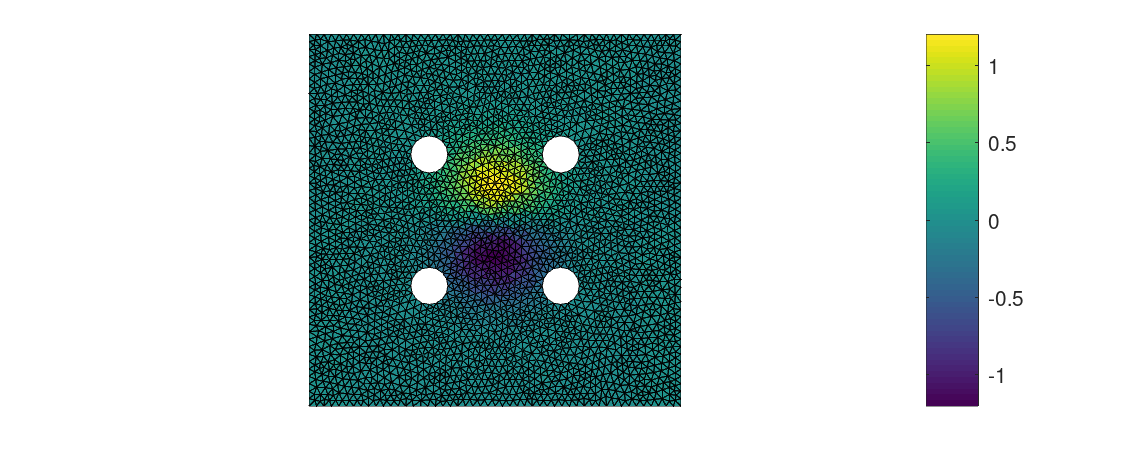
u=Th.eval(@(x,y) 5*exp(-3*(x.^2+y.^2)).*cos(x).*sin(y));
figure(1)
Th.plot(u)
axis off;axis image;colorbar
figure(2)
Th.plot(u)
axis off;axis image;shading interp;colorbar
figure(3)
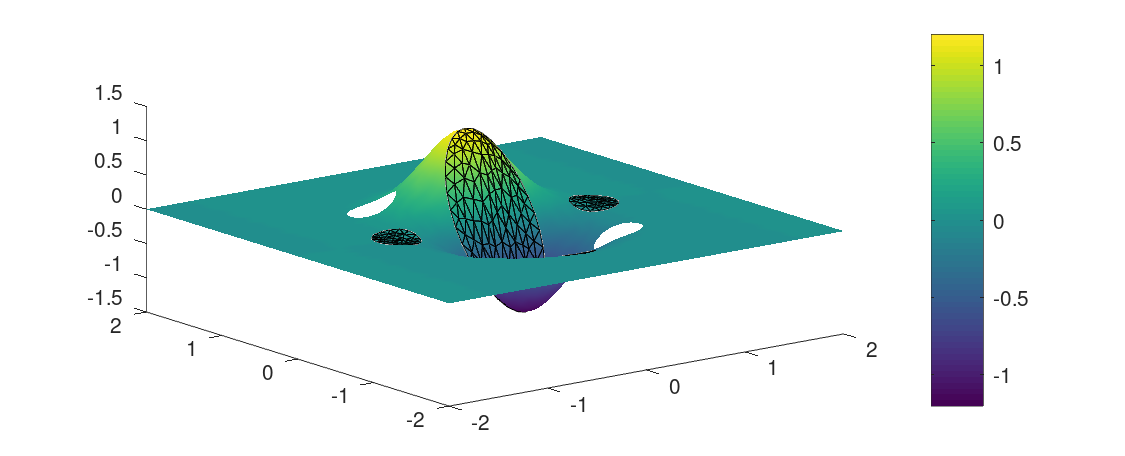
Th.plot(u,'labels',[2:2:8,20],'FaceColor','interp')
view(3);hold on;colorbar
Th.plot(u,'labels',10,'FaceColor','interp','EdgeColor','none')
figure(4)
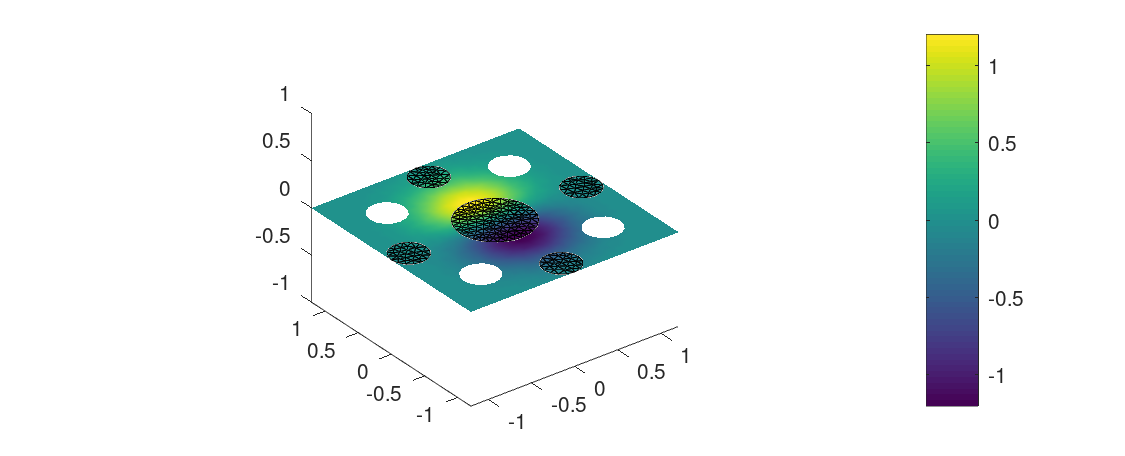
Th.plot(u,'labels',[2:2:8,20], 'plane',true ,'FaceColor','interp')
view(3);hold on;axis image;colorbar
Th.plot(u,'labels',10, 'plane',true, 'FaceColor','interp','EdgeColor','none')
colorbar
fc_tools.graphics.monitors.autoGrid()