
|
Octave-Forge - Extra packages for GNU Octave |
| Home · Packages · Developers · Documentation · FAQ · Bugs · Mailing Lists · Links · Code |
|
|
Octave-Forge - Extra packages for GNU Octave |
| Home · Packages · Developers · Documentation · FAQ · Bugs · Mailing Lists · Links · Code |
Plotting boundaries with labels for a 2D or 3D mesh
Parameters
Th : mesh structure
Optional parameters (of type addParameter):
'LineWidth'(double) To set the line width of boundaries. Default value is 2.
'Color'(string) To define the color of boundaries. Default value is the empty string.
'RGBcolors'(array of doubles) Array of RGB values to set RGB values of the boundaries.
Each region may be identified by a different RGB. Default value is the empty array.
'Legend'(bool) To display the legend or not. Default value is true.
'FontSize'(integer) To set the font size of the legend. Default value is 10.
'labels'(array of integers). To plot only specific regions. Default value is the empty array.
Return values
varargout: array of the RGB colors used by the plot.
Example
PlotBounds(Th, 'LineWidth', 3);
See also: GetMeshOpt.
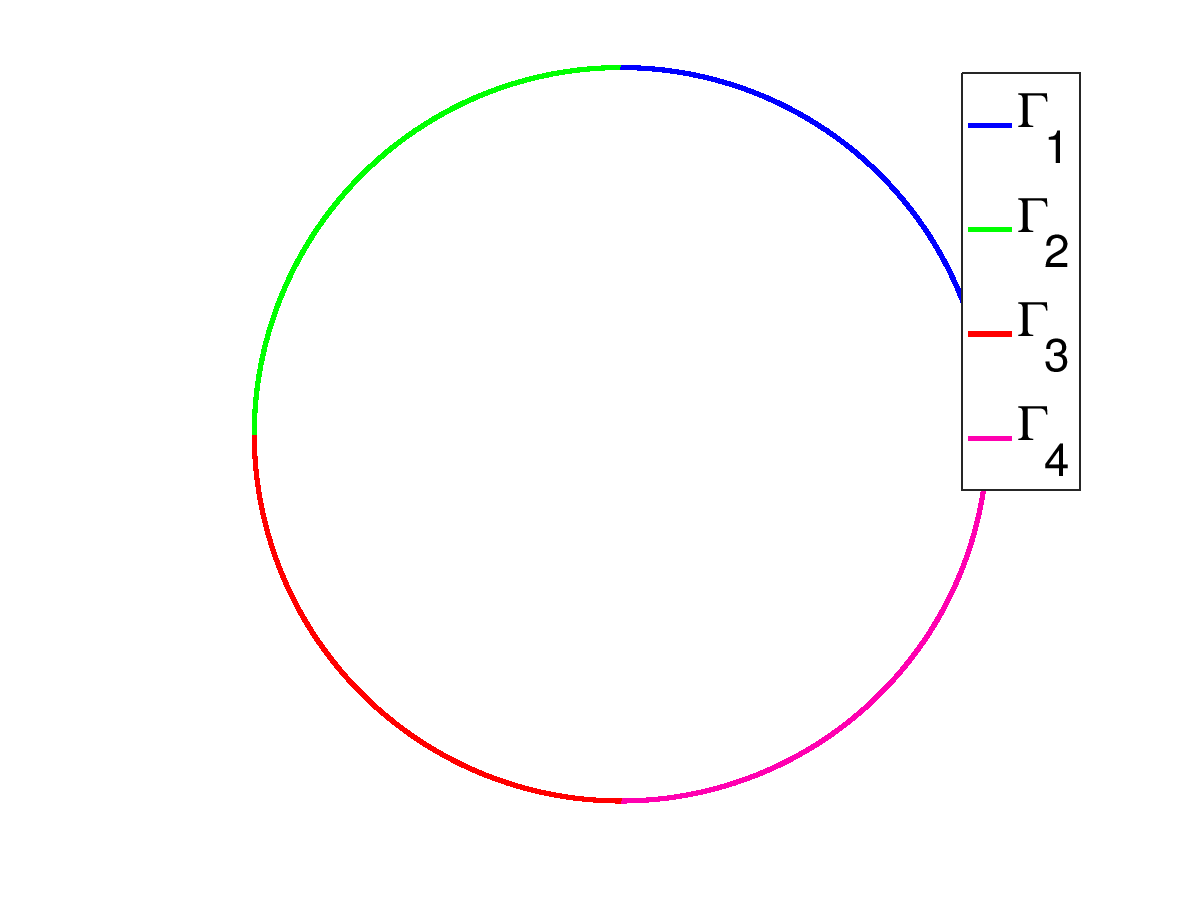
The following code
 Th=GetMeshOpt('disk4-1-50.msh',2);
 PlotBounds(Th);
 set(legend,'FontSize', 24);
Produces the following figure
| Figure 1 |
|---|
 |
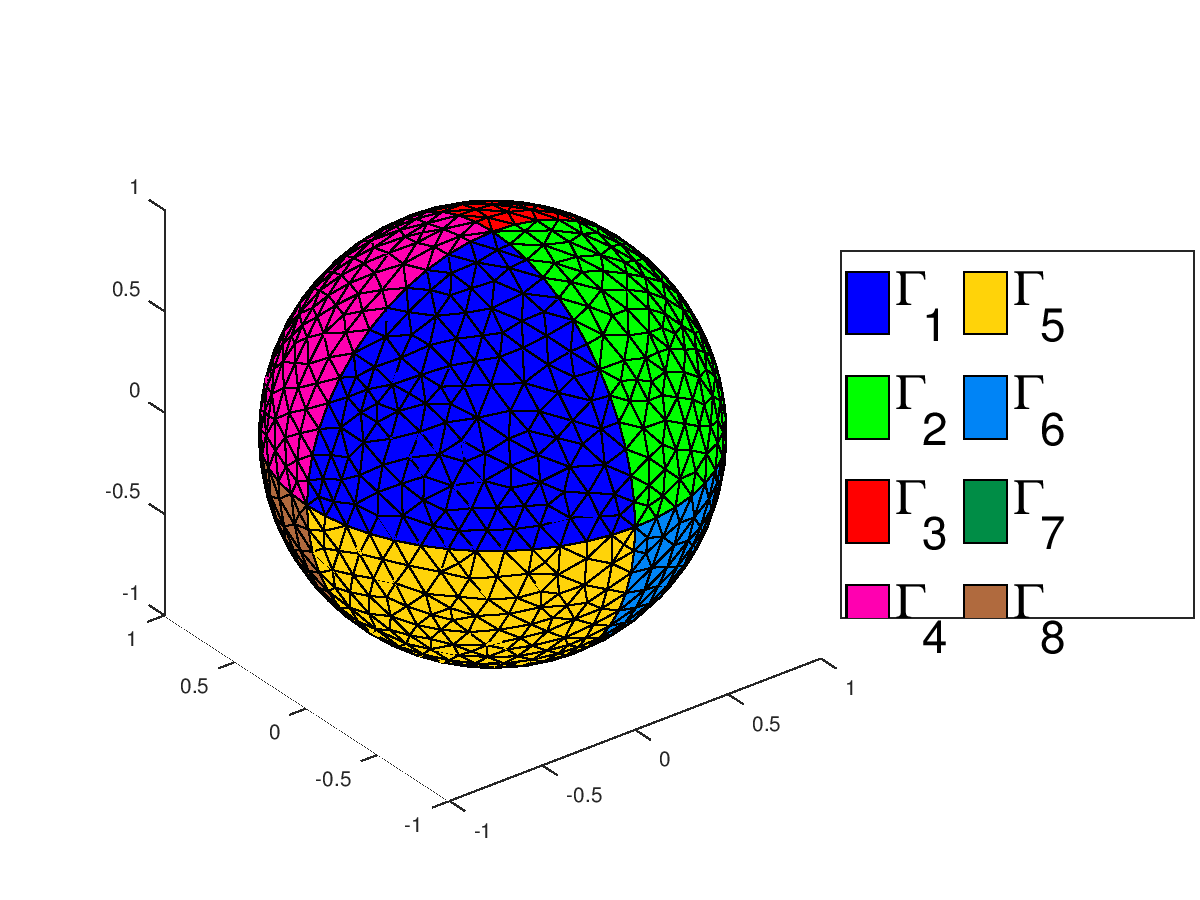
The following code
 Th=GetMeshOpt('sphere8-4.msh', 3, 'format', 'gmsh');
 PlotBounds(Th);
 axis image;
 set(legend,'FontSize',24);
Produces the following figure
| Figure 1 |
|---|
 |
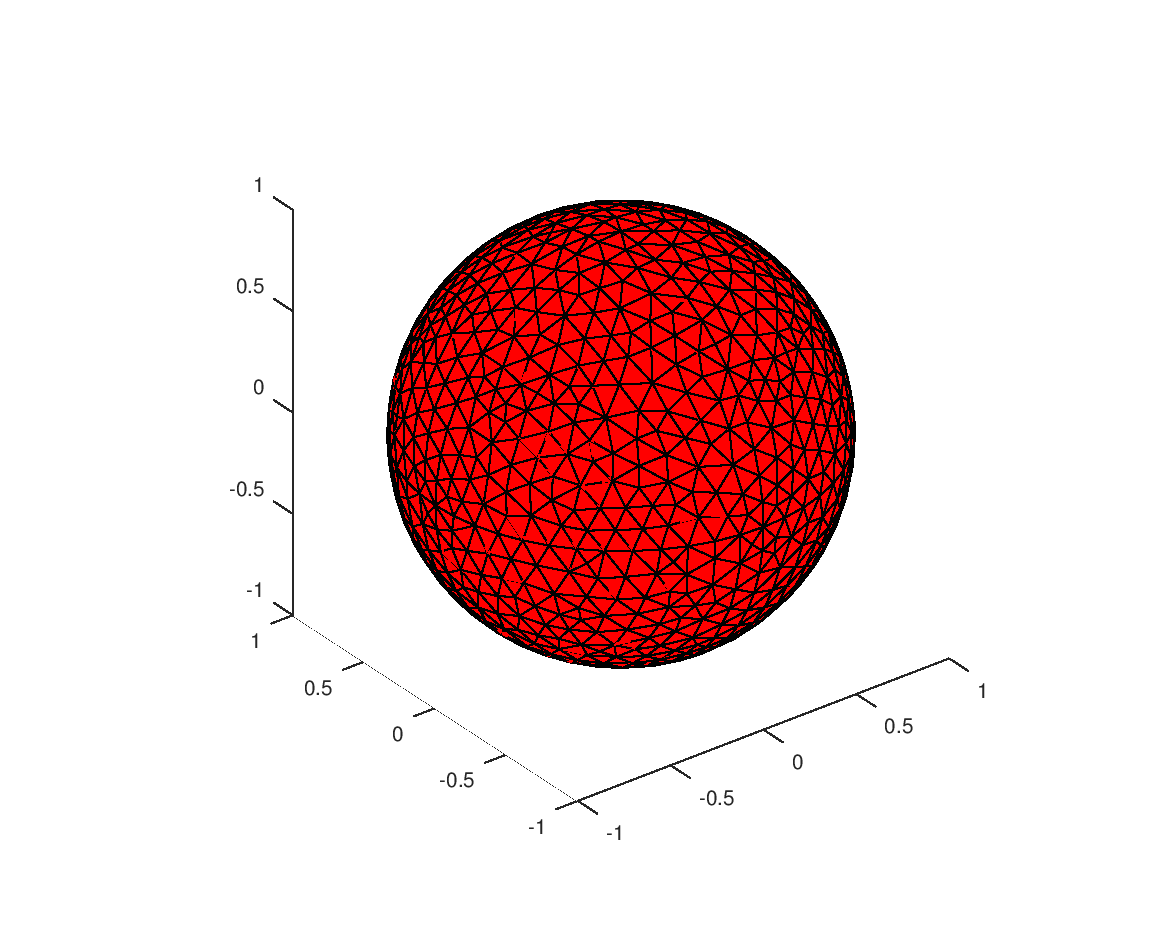
The following code
 Th=GetMeshOpt('sphere8-4.msh',3, 'format', 'gmsh');
 PlotBounds(Th, 'Color', 'red', 'Legend', false);
 axis image;
 set(legend,'FontSize',24);
Produces the following figure
| Figure 1 |
|---|
 |
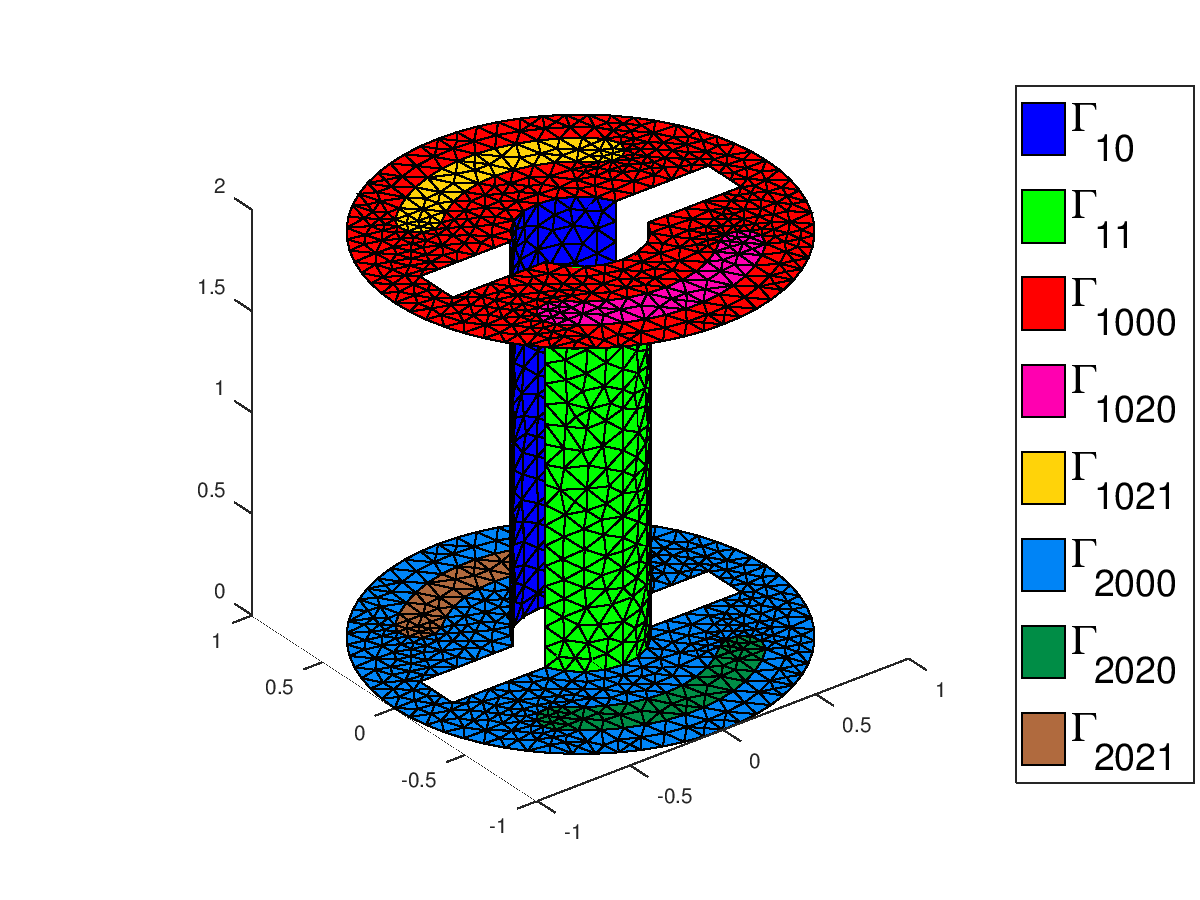
The following code
 Th=GetMeshOpt('cylinderkey-10.msh',3, 'format','gmsh');
 PlotBounds(Th,'labels',[10 11 1000 1020 1021 2000 2020 2021])
 axis image;
 set(legend(),'FontSize',20);
Produces the following figure
| Figure 1 |
|---|
 |
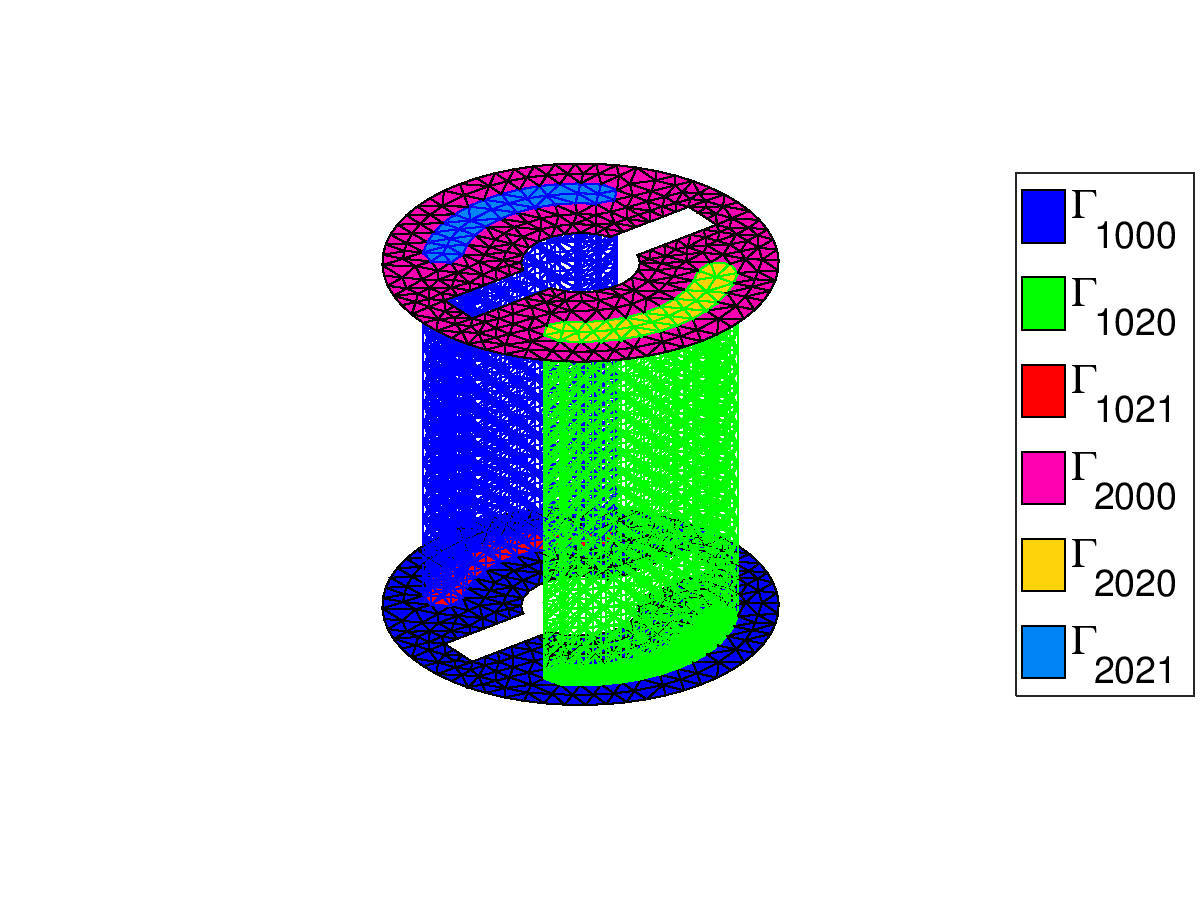
The following code
 Th=GetMeshOpt('FlowVelocity3d01-3.mesh',3);
 PlotBounds(Th,'labels',[1000 1020 1021 2000 2020 2021]);
 PlotMesh(Th,'labels',[8,12]);
 set(legend(),'FontSize',20);
Produces the following figure
| Figure 1 |
|---|
 |
Package: ovisumesh