
|
Octave-Forge - Extra packages for GNU Octave |
| Home · Packages · Developers · Documentation · FAQ · Bugs · Mailing Lists · Links · Code |
|
|
Octave-Forge - Extra packages for GNU Octave |
| Home · Packages · Developers · Documentation · FAQ · Bugs · Mailing Lists · Links · Code |
To write boundary edge numbers
Parameters
Th : mesh structure
Optional parameters (of type AddParameter)
'RGBTextColors'To set the RGB color of boundary edge numbers. Default value is an empty array.
'RGBEdgeColors'To set the RGB color of boundary box edge numbers. Default value is an empty array.
'BackgroundColor'To set the RGB value which sets the boundary edge number background box color. Default value is [1 1 1] (white).
'FontSize'To set the font size of boundary node numbers. Default value is 10.
'FontWeight'(string) To define set the boundary edge number font weight. It can be ’normal’, ’bold’,’light’ or ’demi’. Default value is ’normal’.
'EdgeColor'To set the RGB value of the edge number color. Default value is [0 0 0] (black).
'LineStyle'To set line style of mesh lines to ’none’, ’-’,’–’,’.’ or ’-.’ Default value is ’none’ of mesh lines. Default value is 0.5.
'LineWidth'To set line width of mesh lines. Default value is 0.5.
Examples
PlotEdgeNumber(Th, 'LineWidth', 3);
  PlotMesh(Th,'Color',[0 0 0]);
  RGBcolors=PlotBounds(Th,'LineWidth',2);
  PlotEdgeNumber(Th,'RGBEdgeColors',RGBcolors,'Color',[0 0 0],'LineStyle','-','LineWidth',0.5);
See also: GetMeshOpt, PlotMesh, PlotNodeNumber.
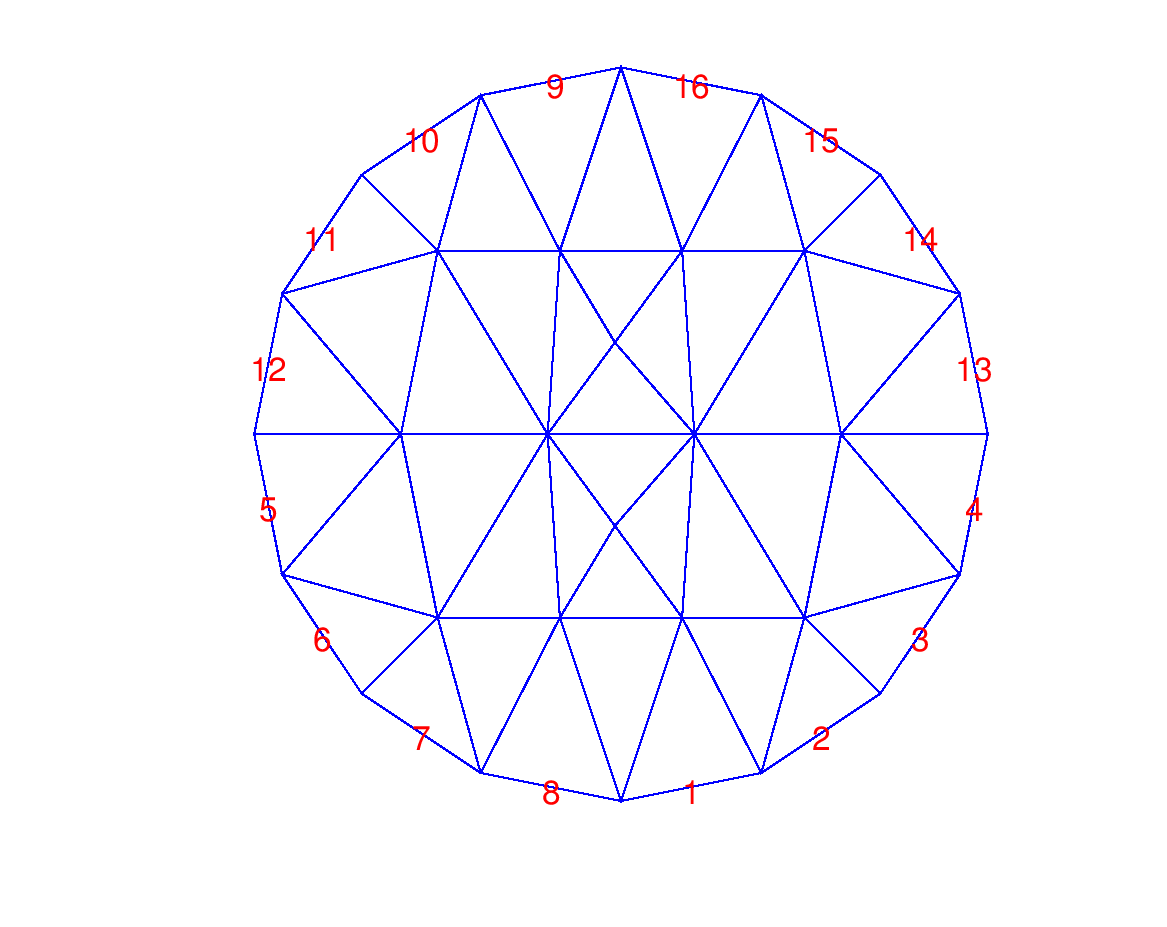
The following code
 Th=GetMeshOpt('disque4-1-4.msh',2);
 PlotMesh(Th);
 PlotEdgeNumber(Th,'Color',[1 0 0],'FontSize',16);
Produces the following figure
| Figure 1 |
|---|
 |
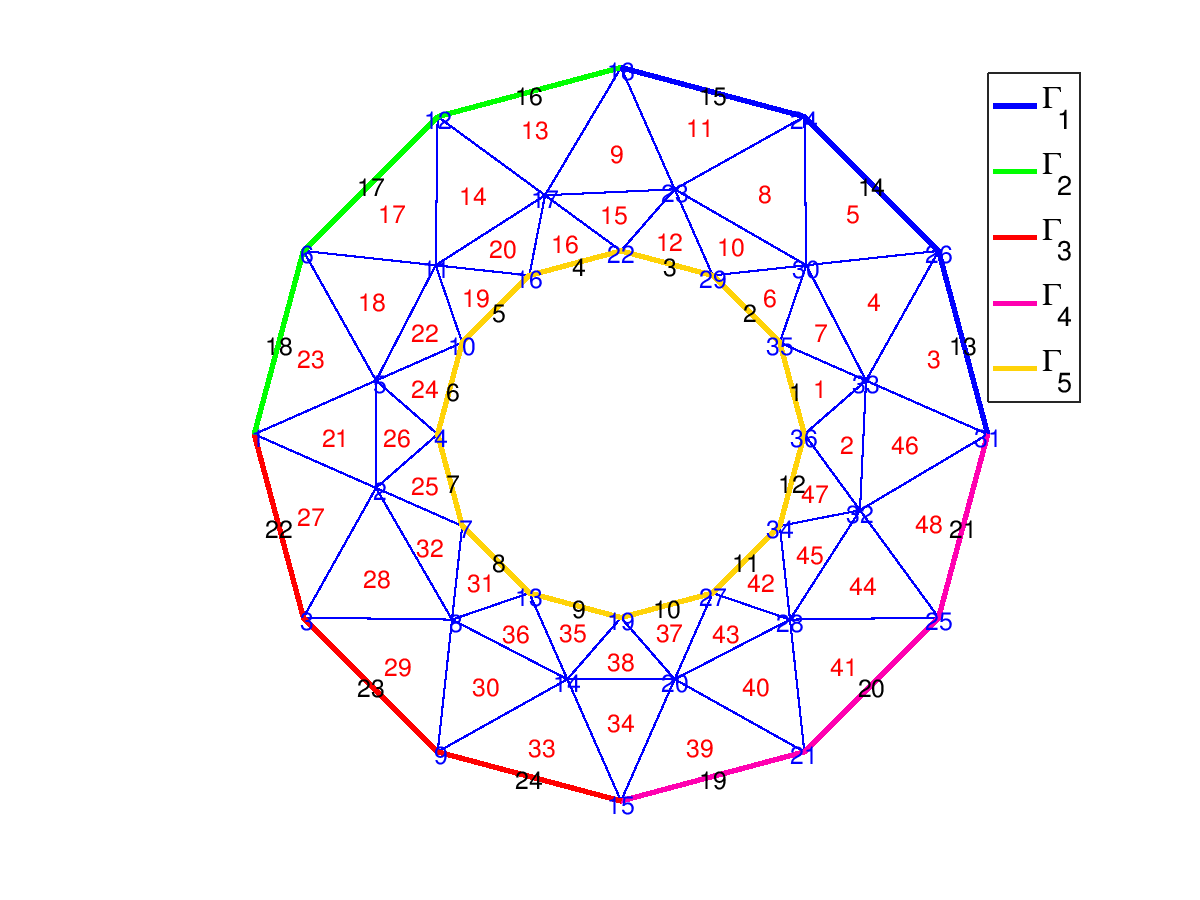
The following code
 Th=GetMeshOpt('Ring-3.msh',2);
 PlotMesh(Th,'RGBcolors', selectColors(length( unique(Th.bel))+1));
 RGBcolors=PlotBounds(Th,'FontSize',15);
 PlotEdgeNumber(Th,'RGBEdgeColors', RGBcolors, 'Color',[0 0 0],'LineStyle','-', 'LineWidth',0.5,'FontSize',12);
 PlotNodeNumber(Th,'Color',[0 0 1],'FontSize',12);
 PlotTriangleNumber(Th,'Color',[1 0 0],'FontSize',12);
Produces the following figure
| Figure 1 |
|---|
 |
Package: ovisumesh