
|
Octave-Forge - Extra packages for GNU Octave |
| Home · Packages · Developers · Documentation · FAQ · Bugs · Mailing Lists · Links · Code |
|
|
Octave-Forge - Extra packages for GNU Octave |
| Home · Packages · Developers · Documentation · FAQ · Bugs · Mailing Lists · Links · Code |
To plot isolines of a scalar field in 2D
Parameters
Th : mesh structure
U : array of doubles of size Th.nq
Optional parameters (of type addParameter):
'niso'(integer) number of isolines to be plotted. Default is 10
'colormap'(string) To set colormap value to ’jet’, ’hsv’, ’gray’, ’colorcube’,’cool’,’spring’,’summer’, ... Default value is ’jet’.
'colorbar'(bool) To set colorbar visible or not. Default is false
'PlotOptions'Cell for defining plotting options. Default value is an empty cell.
'plan'(bool) To plot isolines in 2D in the xOy-plane (if true) or in 3D (if false).
'isorange'array of integers which defines the isoline values. Default value is an empty array and niso isoline values are set in proportion in the range of minimum and maximum values.
'labels'(array of integers). To plot isolines only on specific regions. Default value is the empty array.
Optional output parameter
varargout{1} is the array of RGB colors used by the plot, varargout{2} is the array of isoline values.
Example
Th=GetMeshOpt('disk4-1-50.msh',2);
x=Th.q(1,:);y=Th.q(2,:);
u=2+cos(pi*(x.^2+y.^2));
PlotIsolines(Th,u,'colormap','cool');
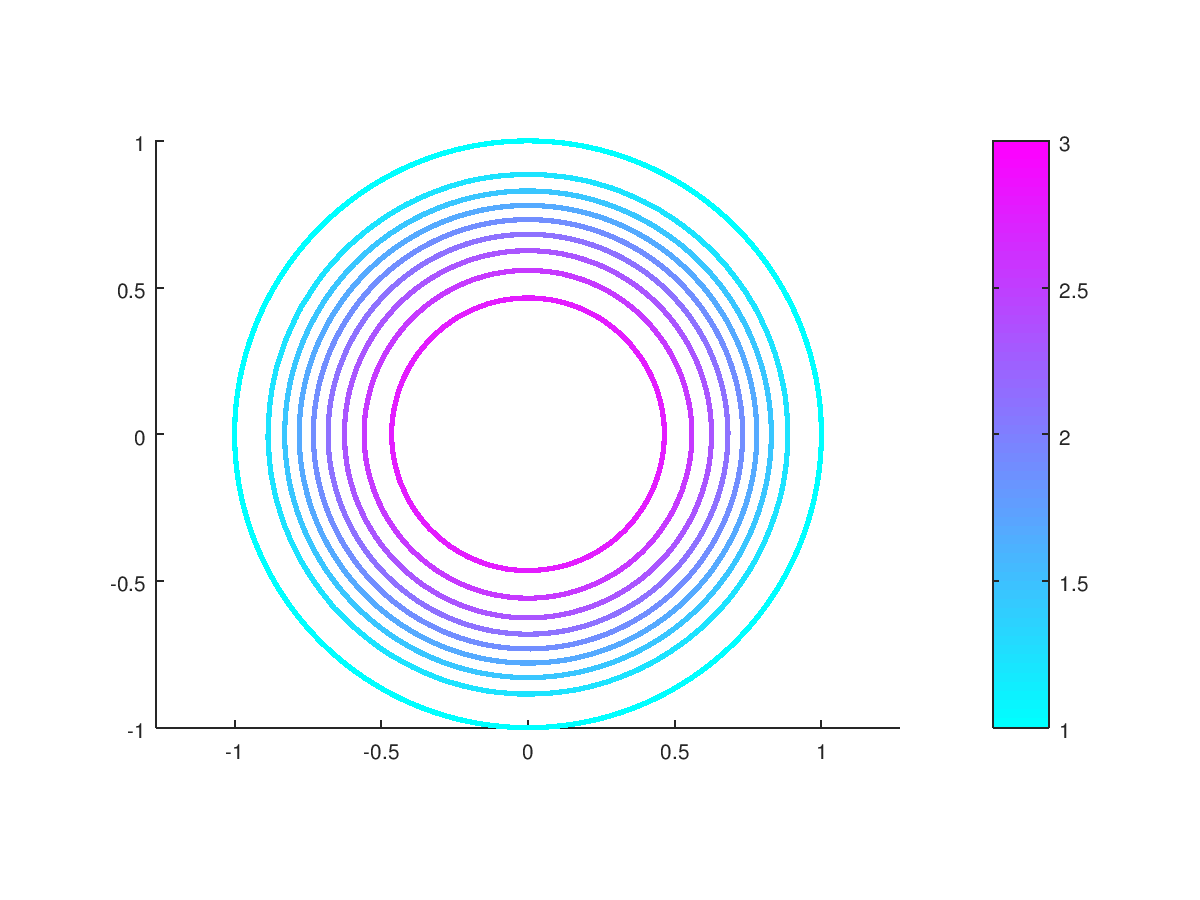
The following code
 Th=GetMeshOpt('disk4-1-50.msh',2);
 x=Th.q(1,:);y=Th.q(2,:);
 u=2+cos(pi*(x.^2+y.^2));
 [colors,values] = PlotIsolines(Th,u, 'colorbar',true,'PlotOptions', {'linewidth',2},'colormap','cool');
Produces the following figure
| Figure 1 |
|---|
 |
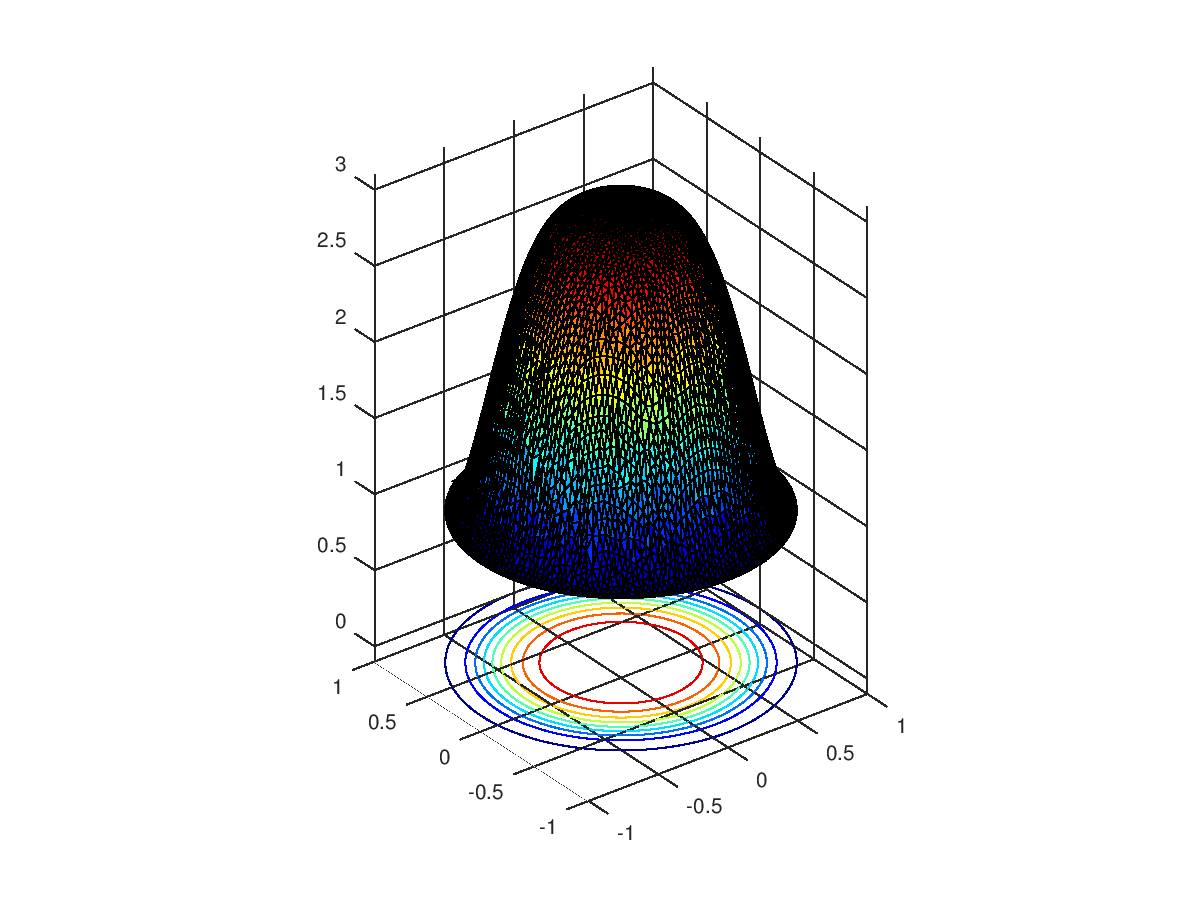
The following code
 Th=GetMeshOpt('disk4-1-50.msh',2);
 x=Th.q(1,:);y=Th.q(2,:);
 u=2+cos(pi*(x.^2+y.^2));
 trisurf(Th.me',Th.q(1,:),Th.q(2,:),u);
 PlotIsolines(Th,u,'plan',true);
 axis([-1 1 -1 1 -0.1 3.1]);
Produces the following figure
| Figure 1 |
|---|
 |
Package: ovisumesh