
|
Octave-Forge - Extra packages for GNU Octave |
| Home · Packages · Developers · Documentation · FAQ · Bugs · Mailing Lists · Links · Code |
|
|
Octave-Forge - Extra packages for GNU Octave |
| Home · Packages · Developers · Documentation · FAQ · Bugs · Mailing Lists · Links · Code |
Plotting a 2D or 3D mesh
Parameters
Th : mesh structure
Optional parameters (of type addParameter)
'Color'(string) To define the color of mesh lines. Default value is the empty string.
'RGBcolors'(array of doubles) Array of RGB values to set RGB values of the mesh lines.
Each region may be identified by a different RGB. Default value is the empty array.
'LineWidth'(double) To set the line width of mesh lines. Default value is 0.5.
'FaceAlpha'(integer) To set the transparency (only in 3D). 0 means no transparency. Default value is 0.
'labels'(array of integers). To plot only specific regions. Default value is the empty array.
'Legend'(bool) To display the legend or not. Default value is false.
Example
  Th=GetMeshOpt('meshes/disque4-1-20.msh');
  PlotMesh(Th, 'LineWidth', 1.0)
See also: GetMeshOpt.
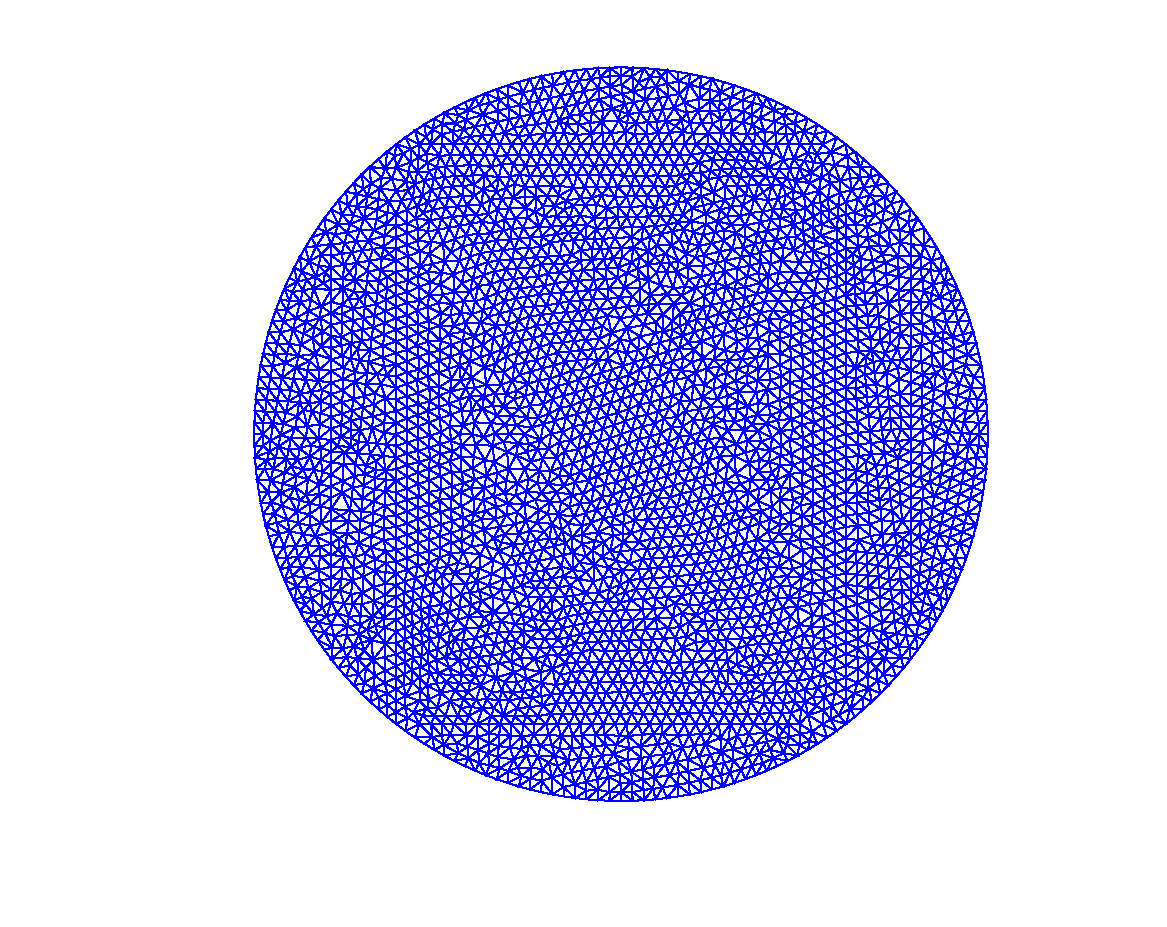
The following code
 Th=GetMeshOpt('disk4-1-50.msh',2);
 PlotMesh(Th);
 set(legend,'FontSize',24);
Produces the following figure
| Figure 1 |
|---|
 |
The following code
 Th=GetMeshOpt('disque4-1-20.msh',2);
 PlotMesh(Th,'LineWidth',1.0);
 set(legend,'FontSize',24);
Produces the following figure
| Figure 1 |
|---|
 |
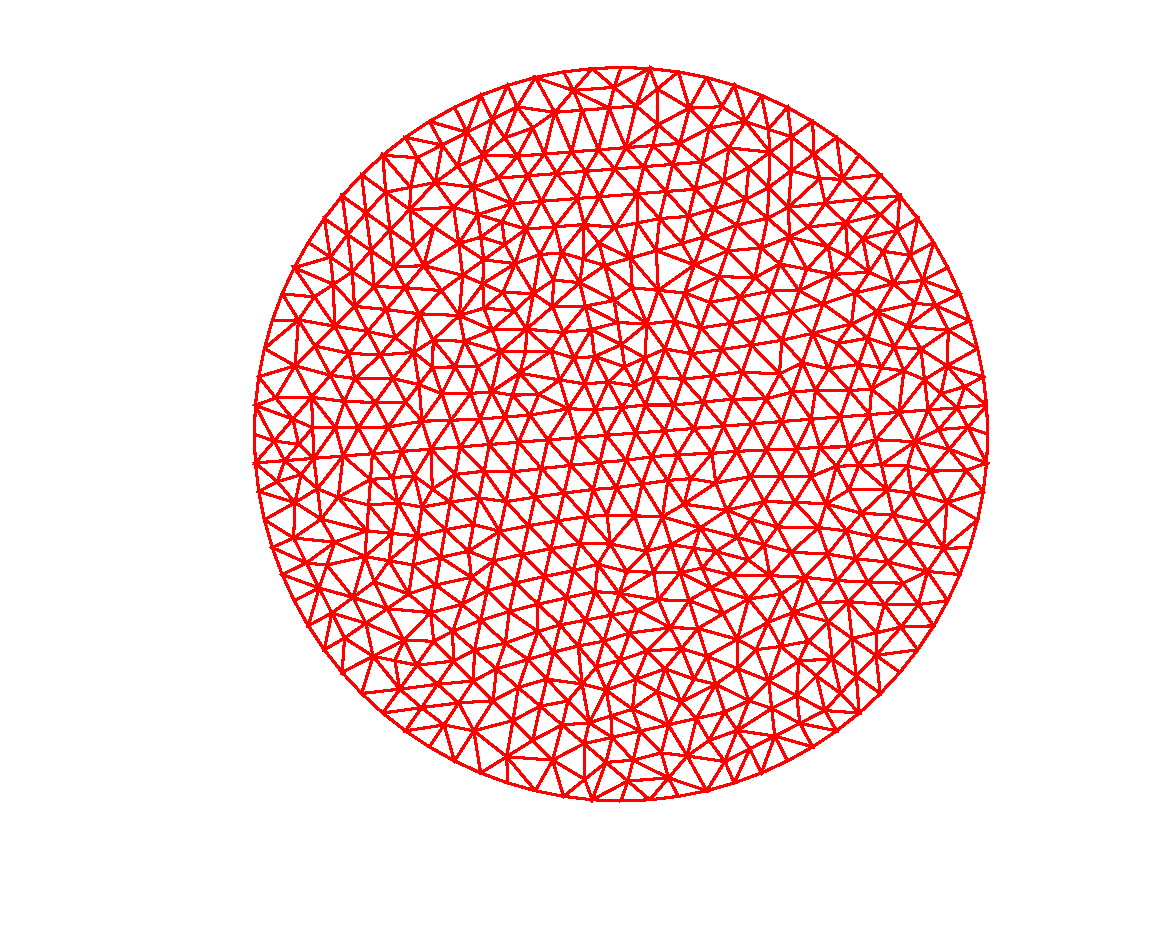
The following code
 Th=GetMeshOpt('disque4-1-20.msh',2);
 PlotMesh(Th,'LineWidth', 1.0, 'RGBcolors', [1 0 0]);
 set(legend,'FontSize',24);
Produces the following figure
| Figure 1 |
|---|
 |
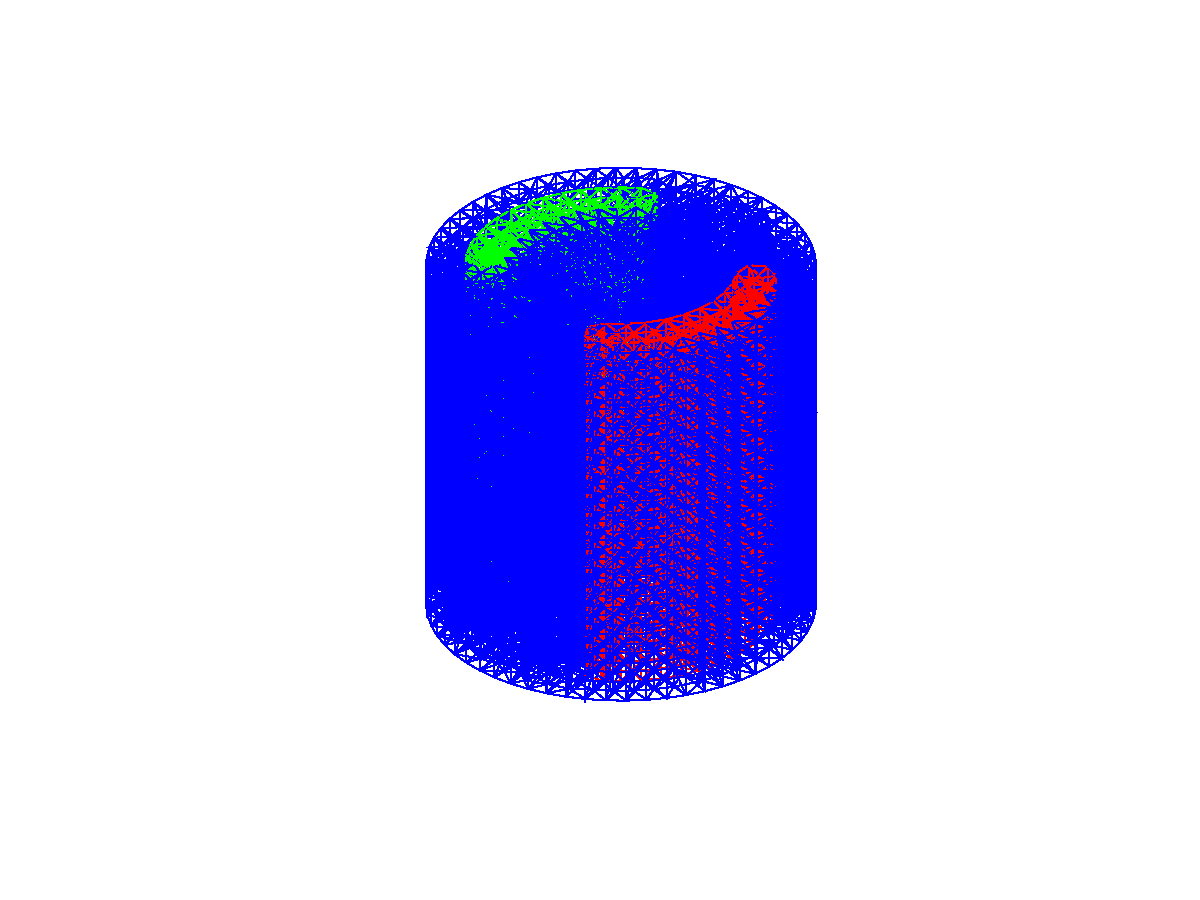
The following code
 Th=GetMeshOpt( 'FlowVelocity3d01-3.mesh',3);
 PlotMesh(Th);
 set(legend(),'FontSize',24);
Produces the following figure
| Figure 1 |
|---|
 |
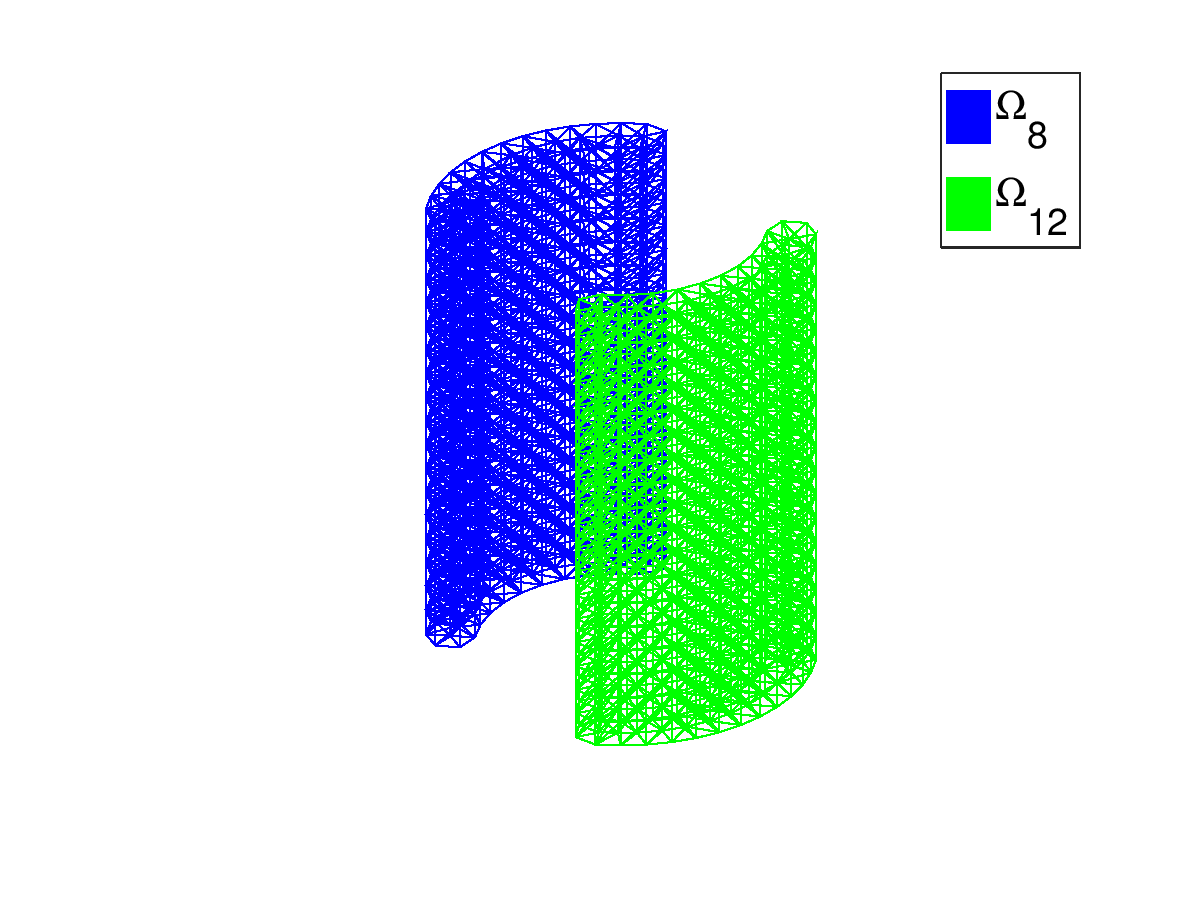
The following code
 Th=GetMeshOpt( 'FlowVelocity3d01-3.mesh',3);
 PlotMesh(Th,'labels',[8 12],'Legend',true);
 set(legend(),'FontSize',20);
Produces the following figure
| Figure 1 |
|---|
 |
Package: ovisumesh