
|
Octave-Forge - Extra packages for GNU Octave |
| Home · Packages · Developers · Documentation · FAQ · Bugs · Mailing Lists · Links · Code |
|
|
Octave-Forge - Extra packages for GNU Octave |
| Home · Packages · Developers · Documentation · FAQ · Bugs · Mailing Lists · Links · Code |
To plot a nodal variable on a 3D mesh.
Parameters
Th : mesh structure
Val : 3-by-Th.nq array of doubles
Optional parameters (of type addParameter)
'colormap'To set colormap value to ’jet’, ’hsv’, ’gray’, ’colorcube’,’cool’,’spring’,’summer’, ... Default value is ’jet’.
'shading'To use shading interp if true. Default value is true
'colorbar'To display the colorbar or not. Default value is true.
'caxis'array of four doubles to set the axis. Default value is an empty array.
'PlotOptions'a cell to define plotting options. Default value is an empty cell.
Optional output argument
h is the handle to the figure
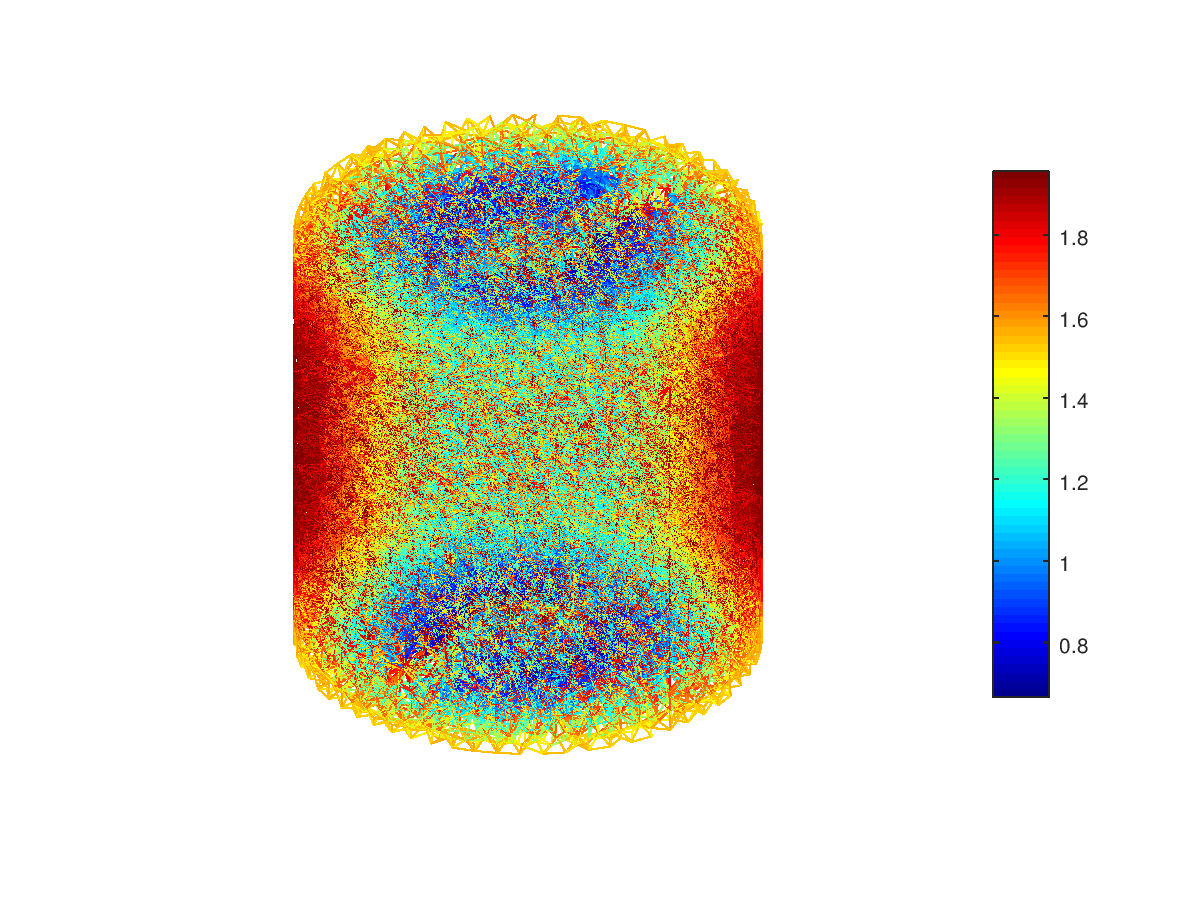
The following code
 Th=GetMeshOpt('cylinderkey-10.msh',3, 'format','gmsh');
 f=@(x,y,z) x.^2+y.^2+cos((z-1).^2);
 U=f(Th.q(1,:),Th.q(2,:),Th.q(3,:));
 set(legend(),'FontSize',24);
 PlotVal3D(Th,U,'shading',false);
Produces the following figure
| Figure 1 |
|---|
 |
Package: ovisumesh