
|
Octave-Forge - Extra packages for GNU Octave |
| Home · Packages · Developers · Documentation · FAQ · Bugs · Mailing Lists · Links · Code |
|
|
Octave-Forge - Extra packages for GNU Octave |
| Home · Packages · Developers · Documentation · FAQ · Bugs · Mailing Lists · Links · Code |
To display fields corresponding to nodal variables on the surface of a 3D mesh.
parameters
Th : mesh structure
x : array of doubles of size Th.nq
Optional parameters (of type AddParamValue)
'colormap'To set colormap value to ’jet’, ’hsv’, ’gray’, ’colorcube’,’cool’,’spring’,’summer’, ... Default value is ’jet’.
'colorbar'To set colorbar visible if true. Default value is true
'labels'array of labels (integer) to plot only specific regions.
'PlotOptions'(cell) Plotting options. Default value is an empty cell.
See also: PlotVal, Plot3DSurfIsolines.
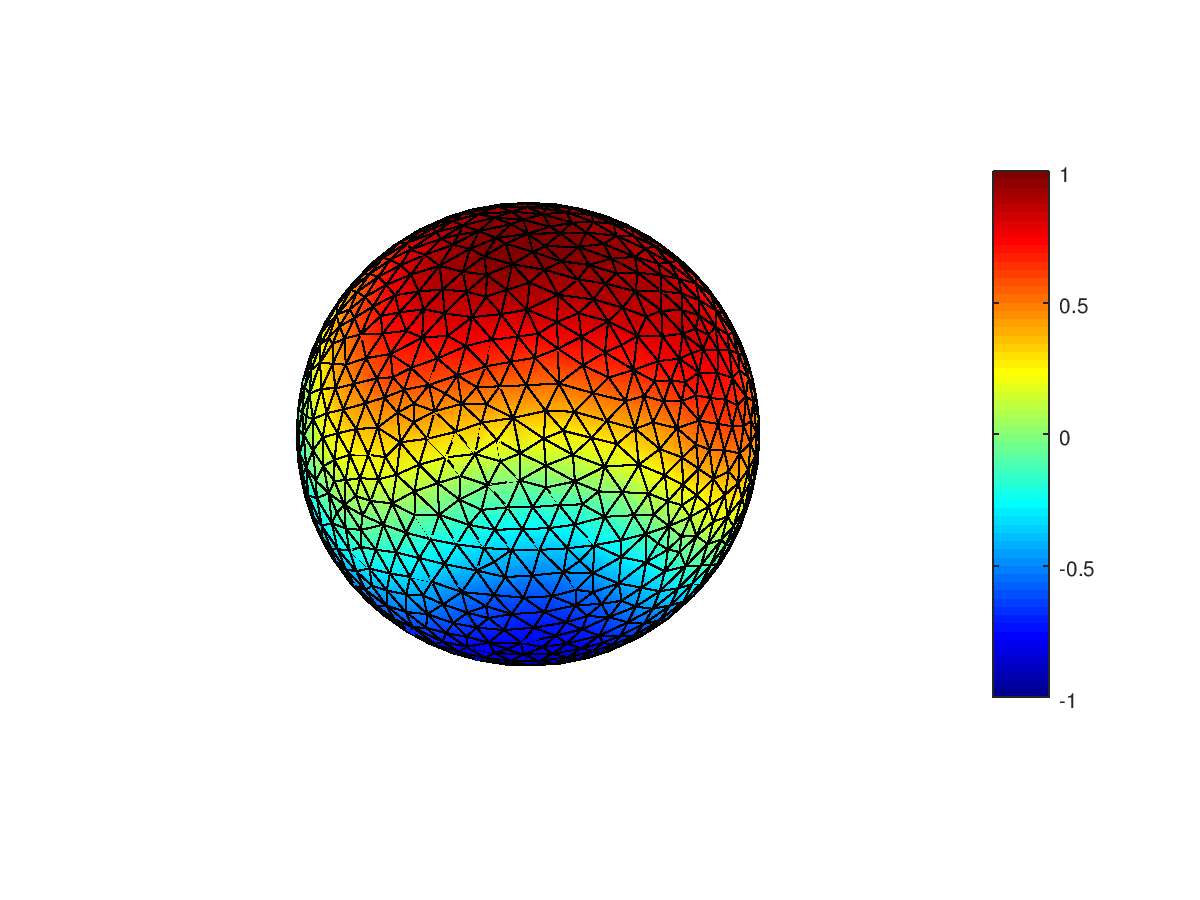
The following code
 Th=GetMeshOpt('sphere8-4.msh',3,'format','gmsh');
 f=@(x,y,z) x.*y.^2+z;
 Plot3DSurfVal(Th,f(Th.q(1,:),Th.q(2,:),Th.q(3,:)));
 set(legend,'FontSize',24);
Produces the following figure
| Figure 1 |
|---|
 |
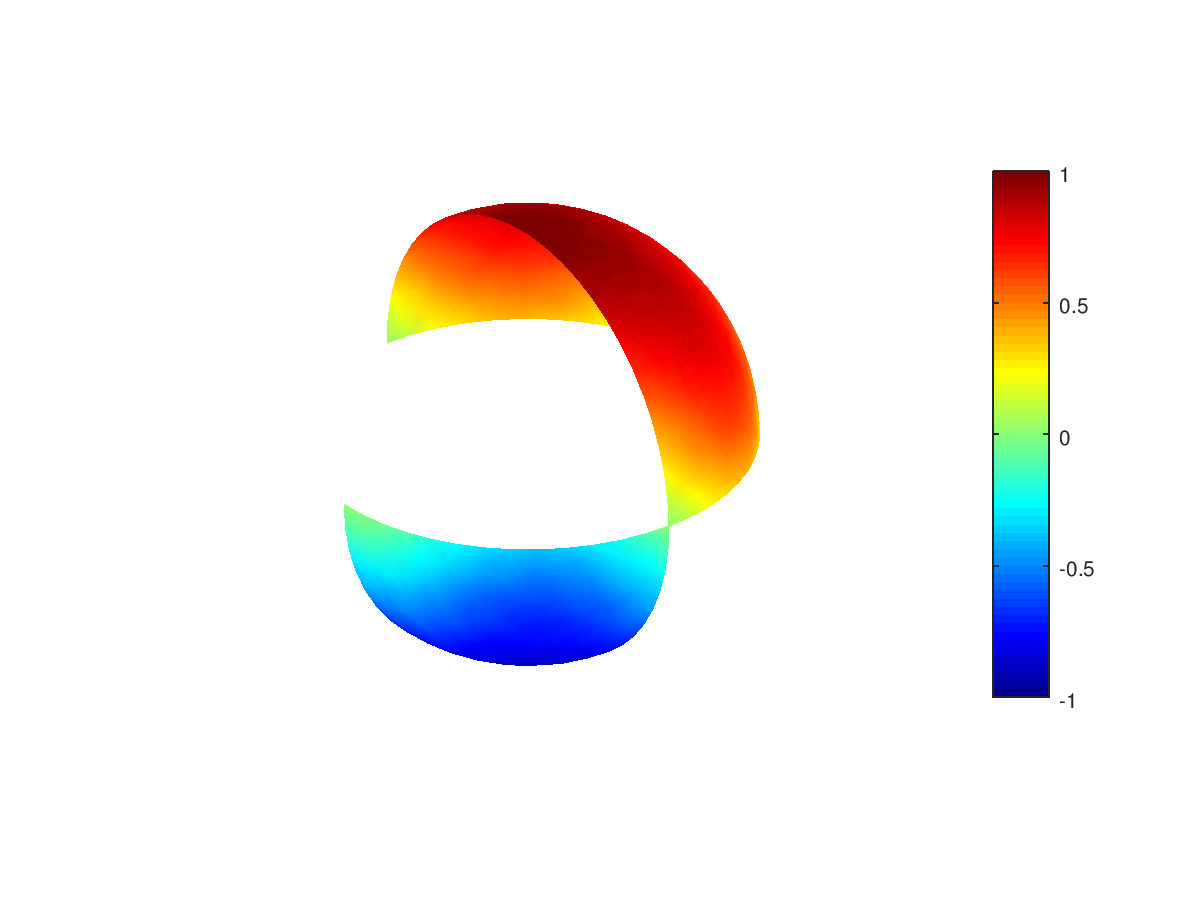
The following code
 Th=GetMeshOpt('sphere8-4.msh',3,'format','gmsh');
 f=@(x,y,z) x.*y.^2+z;
 Plot3DSurfVal(Th,f(Th.q(1,:),Th.q(2,:),Th.q(3,:)),'labels',[2,3,5],'PlotOptions',{'EdgeColor','none'});
 set(legend,'FontSize',24);
Produces the following figure
| Figure 1 |
|---|
 |
Package: ovisumesh