
|
Octave-Forge - Extra packages for GNU Octave |
| Home · Packages · Developers · Documentation · FAQ · Bugs · Mailing Lists · Links · Code |
|
|
Octave-Forge - Extra packages for GNU Octave |
| Home · Packages · Developers · Documentation · FAQ · Bugs · Mailing Lists · Links · Code |
To plot a nodal variable on a 2D mesh
Parameters
Th : mesh structure
Val : 2-by-Th.nq array of doubles
Optional parameters (of type addParameter)
CameraPositionarray of two doubles to set the camera position. Default value is view(2)
colormapTo set colormap value to ’jet’, ’hsv’, ’gray’, ’colorcube’,’cool’,’spring’,’summer’, ... Default value is ’jet’.
shadingTo use shading interp if true. Default value is true
colorbarTo set colorbar visible if true. Default value is true
labelsarray of labels (integer) to plot only specific regions.
caxisarray of four doubles to set the axis. Default value is an empty array.
Example
PlotVal(Th,u,'colormap','cool');
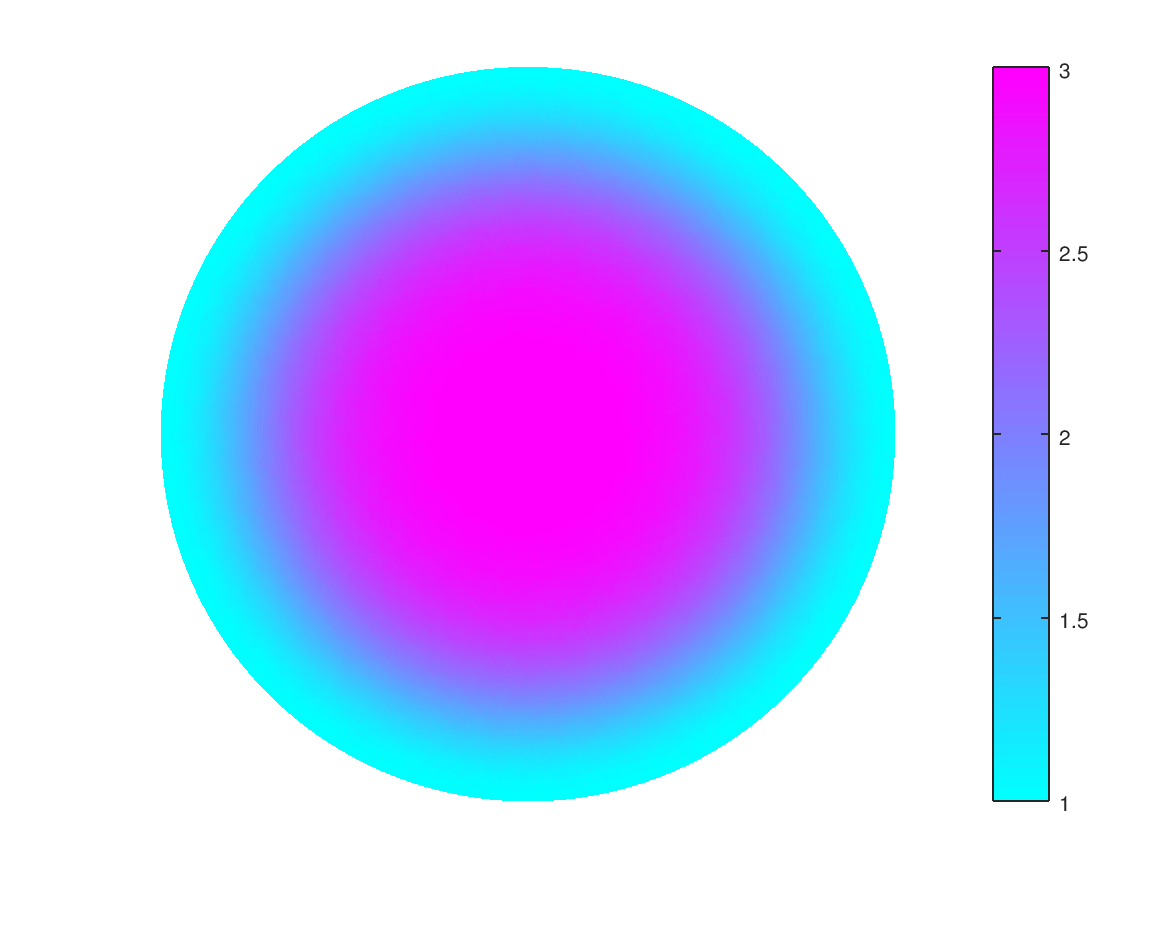
The following code
 Th=GetMeshOpt('disk4-1-50.msh',2);
 x=Th.q(1,:);y=Th.q(2,:);
 u=2+cos(pi*(x.^2+y.^2));
 PlotVal(Th,u,'colormap','cool');
 set(legend(),'FontSize',24);
Produces the following figure
| Figure 1 |
|---|
 |
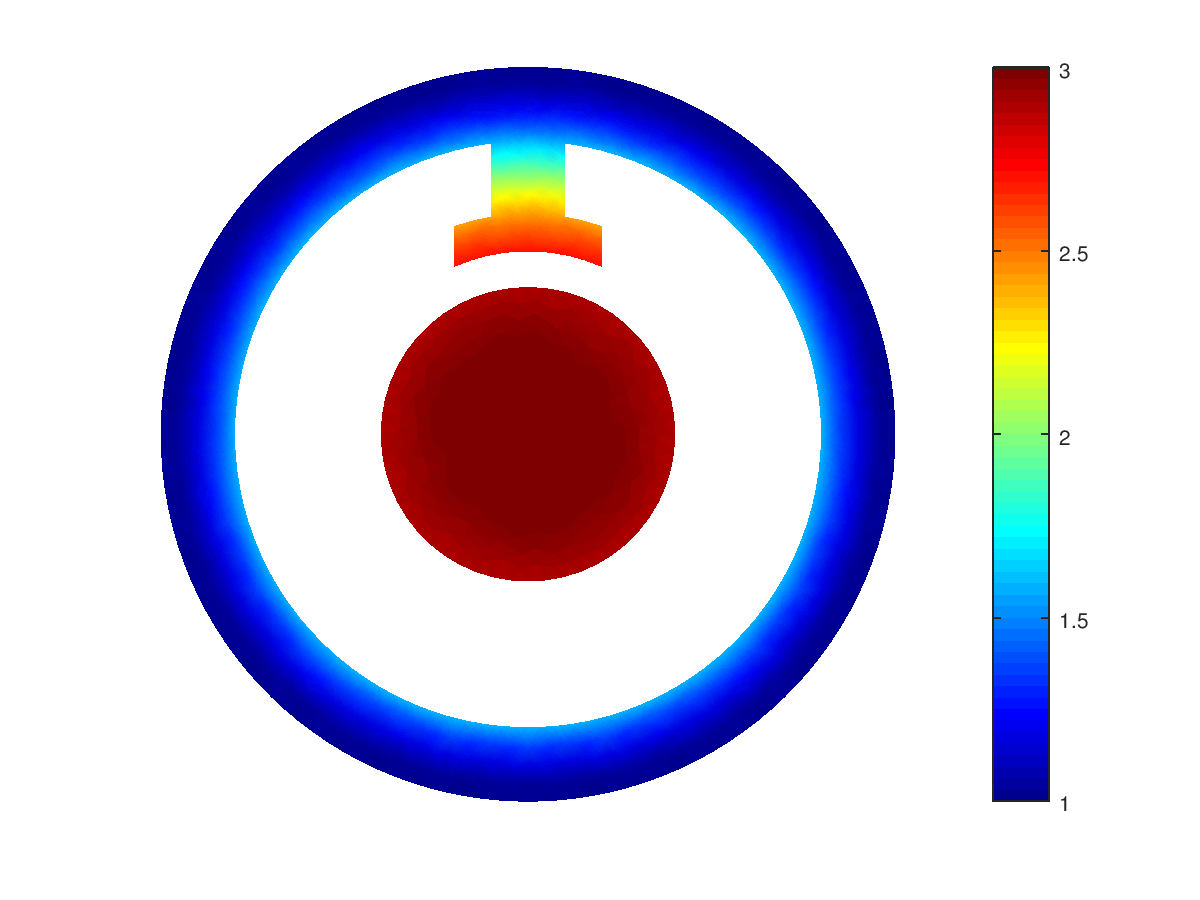
The following code
 Th=GetMeshOpt('magnetism.msh',2,'format','gmsh');
 x=Th.q(1,:);y=Th.q(2,:);
 u=2+cos(pi*(x.^2+y.^2));
 PlotVal(Th,u,'labels',[3,5]);
 set(legend(),'FontSize',24);
Produces the following figure
| Figure 1 |
|---|
 |
Package: ovisumesh